Web Health
What each client website says about itself, from a plugin installed on it: versions, updates, settings and security events — and the tickets its findings open on their own.
/admin/sites — every client website that reports on itself, on one screen. A small
plugin on each WordPress site sends what it can see about itself: what it is running, what is out
of date, what has changed, and what looks wrong. Findings become tickets on their own.
#The question this page answers
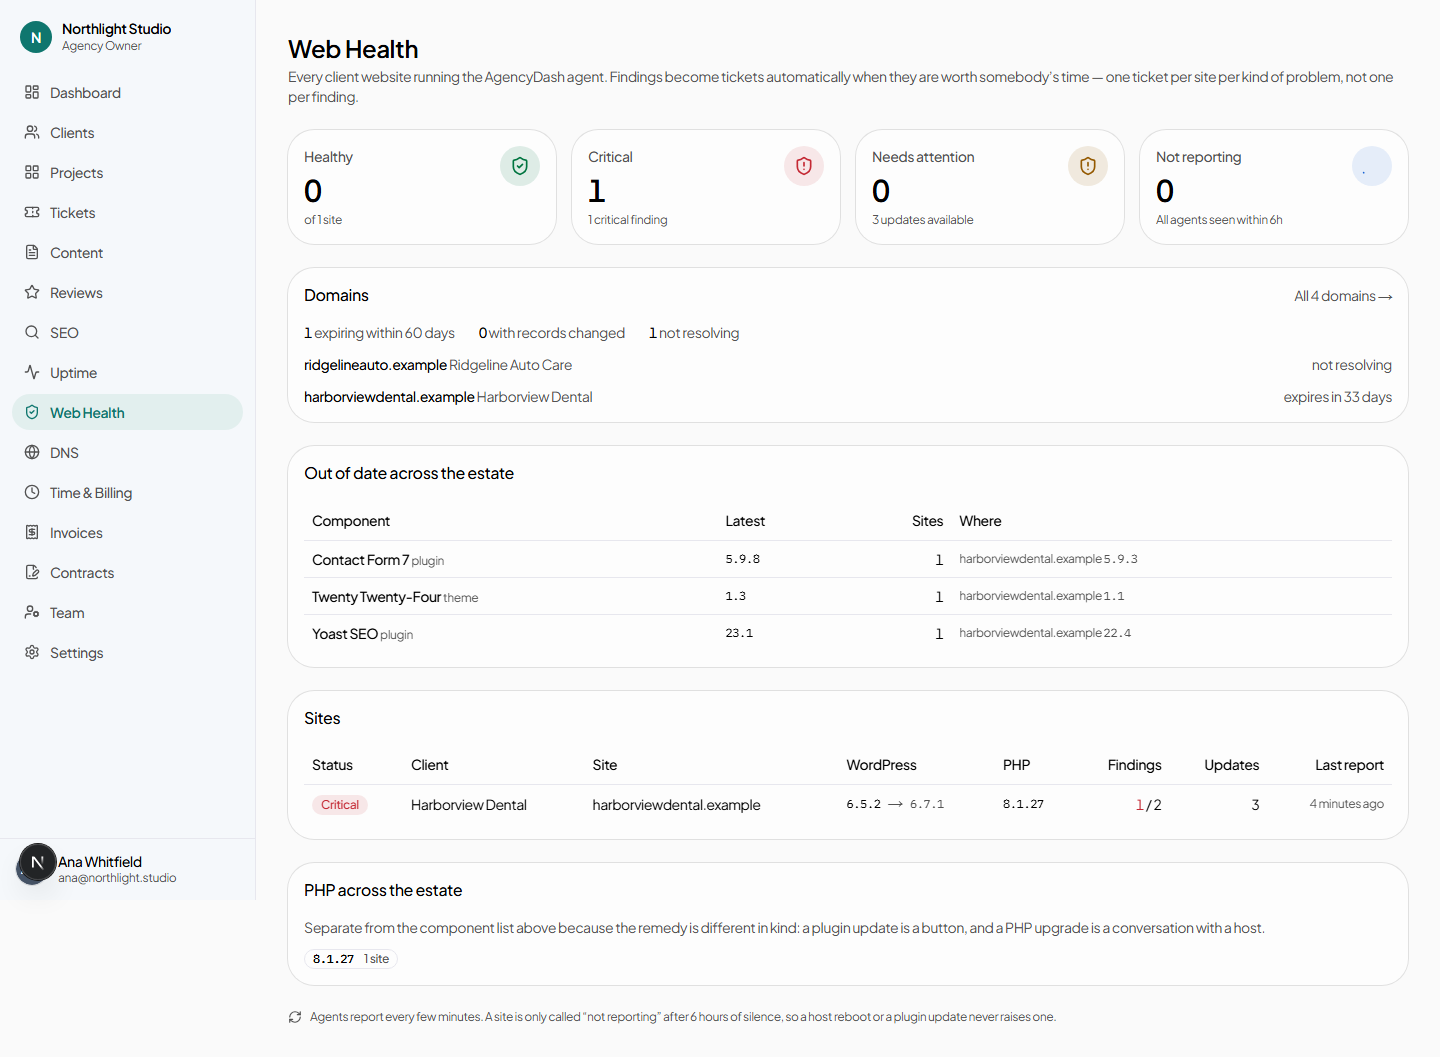
Not “how is this site” — the client record already answers that. The one an agency running two hundred sites asks first: is anything on fire, and is it the same thing in fourteen places. So the ordering is by how bad, never by client name, and the cross-site roll-ups sit above the per-site table rather than under it.
#The four states
| State | Means |
|---|---|
| Not reporting | The plugin has said nothing for six hours. Nothing shown for this site is current. |
| Critical | At least one critical finding standing — the kind worth interrupting somebody for. |
| Needs attention | Warnings only. Updates available, settings worth changing. |
| Healthy | Reporting, nothing standing. |
Six hours, rather than minutes, because plugins report every few minutes and a host reboot or an update should never raise an alarm on its own.
#Connecting a site
There is no Add a site form here, deliberately — the same as the uptime page. Plugins attach to websites that are already on a client profile, and connecting one happens on the row it belongs to.
- Switch Website Health on for the client, under the client record's Settings tab. With it off there is no Connect button and nothing says why.
- On the client record's Profile tab, find the website under Websites and press Connect. A pairing code appears.
- Install the AgencyDash plugin on the WordPress site and paste the code into Settings → AgencyDash.
Connecting a WordPress site walks all of that through with screenshots of both sides, and lists what to check when a site will not connect.
Disconnect stops the plugin being able to report and closes every open finding for that site. Everything already collected is kept.
#Findings, and the tickets they become
A finding is something the plugin noticed: an out-of-date core or plugin, SSL off, debug mode left on, file editing enabled, directory listing open, an administrator account nobody opened a ticket for, a run of failed logins.
Findings become tickets automatically, and the rule is one ticket per site per kind of problem — not one per finding. Fourteen out-of-date plugins on one site is one ticket, and it updates itself as the list changes rather than filling the queue. When the underlying findings clear, the ticket is resolved.
#One site
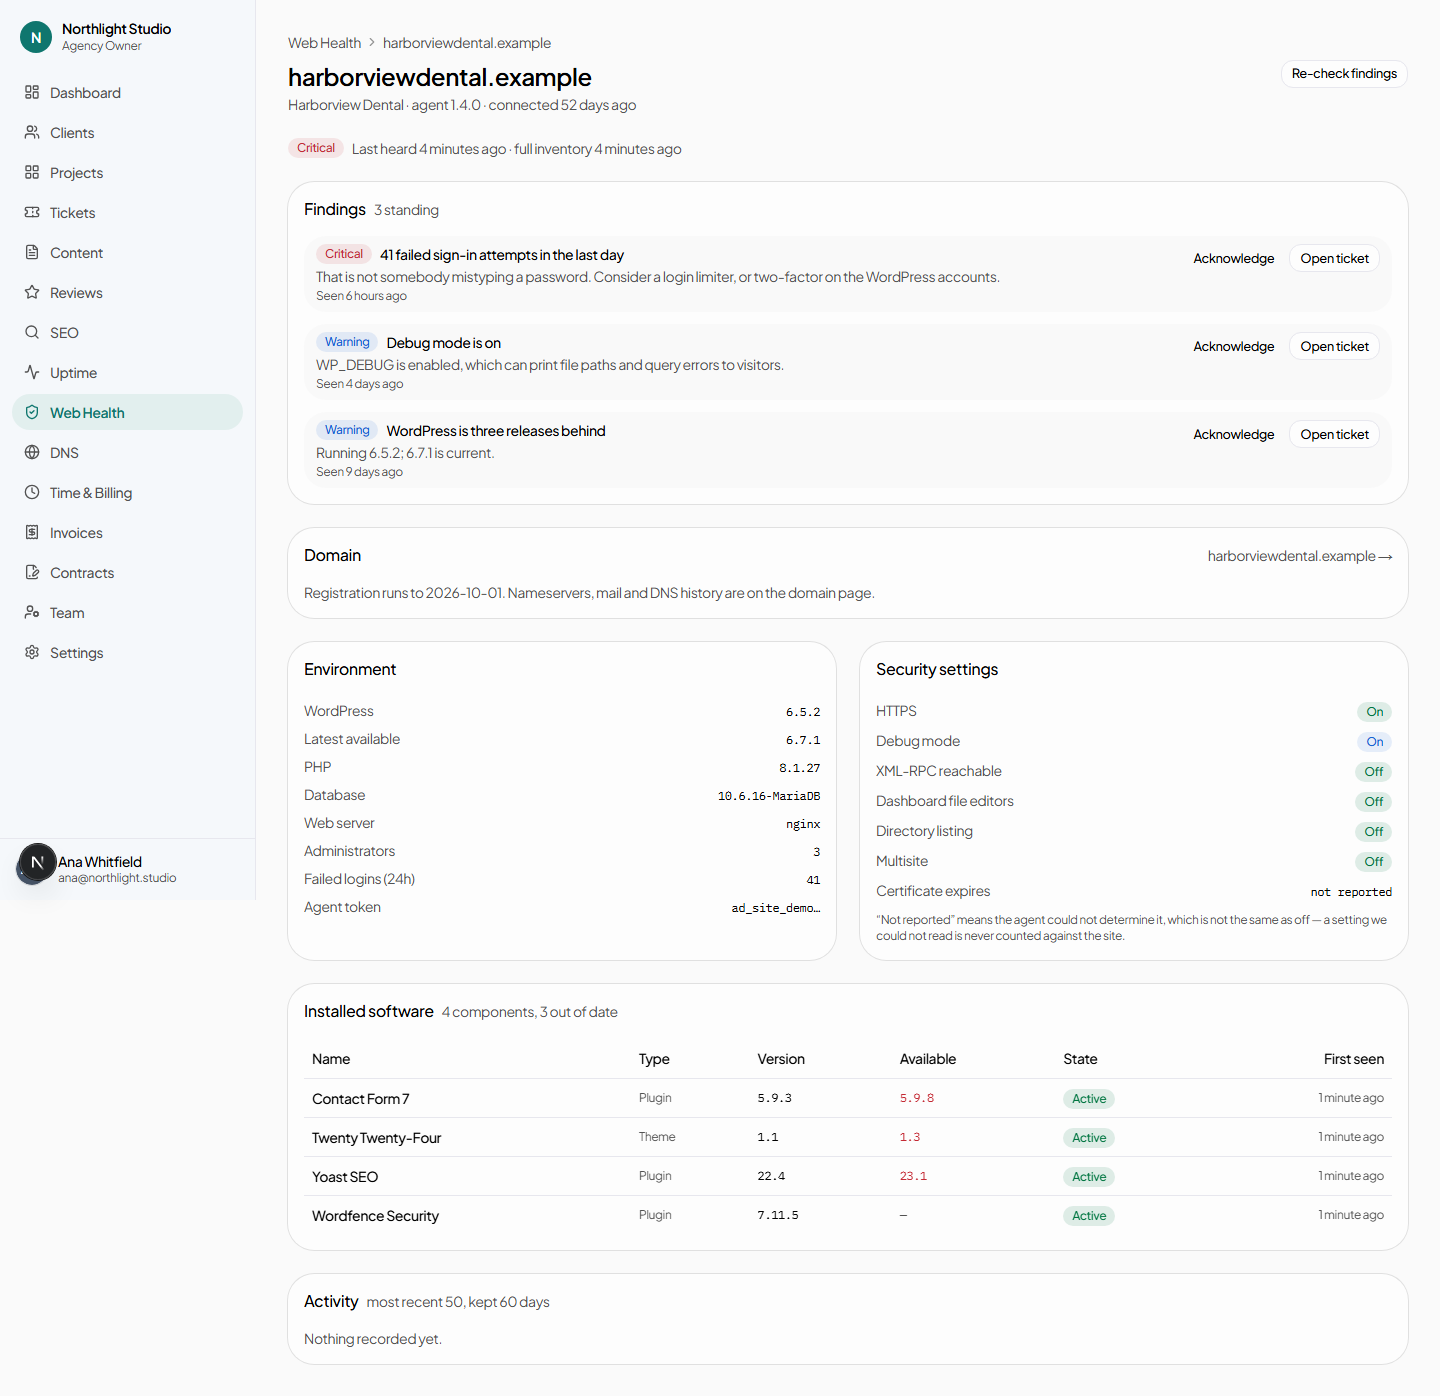
Four sections, in the order somebody actually works through them:
- Findings — what is standing now, with the ticket each one produced.
- Environment — WordPress and PHP versions, database, server, and the settings worth knowing about.
- Components — plugins and themes, with what is out of date.
- Events — what has happened, kept for 60 days.
#Across the estate
Above the per-site table, two roll-ups answer the “is it the same thing in fourteen places” question:
- Out of date across the estate — one row per plugin or theme, with how many sites are behind and which ones.
- PHP across the estate — kept separate, because the remedy is different in kind. A plugin update is a button; a PHP upgrade is a conversation with a host.
#What the client sees
Nothing directly — there is no Web Health page in the client portal. What reaches them is the tickets, in Requests, like any other work. That is deliberate: the fleet view is the agency's operational picture, and a client does not need a dashboard of everything that has ever been out of date on their site.