Uptime
Monitoring client websites, what counts as down, and the incident history that proves it.
/admin/uptime — whether your clients' websites are answering, how quickly, and what
happened the last time one stopped. Adding a website marked Live to a client already
started this; the page is where you confirm it and manage the rest.
#The monitor list
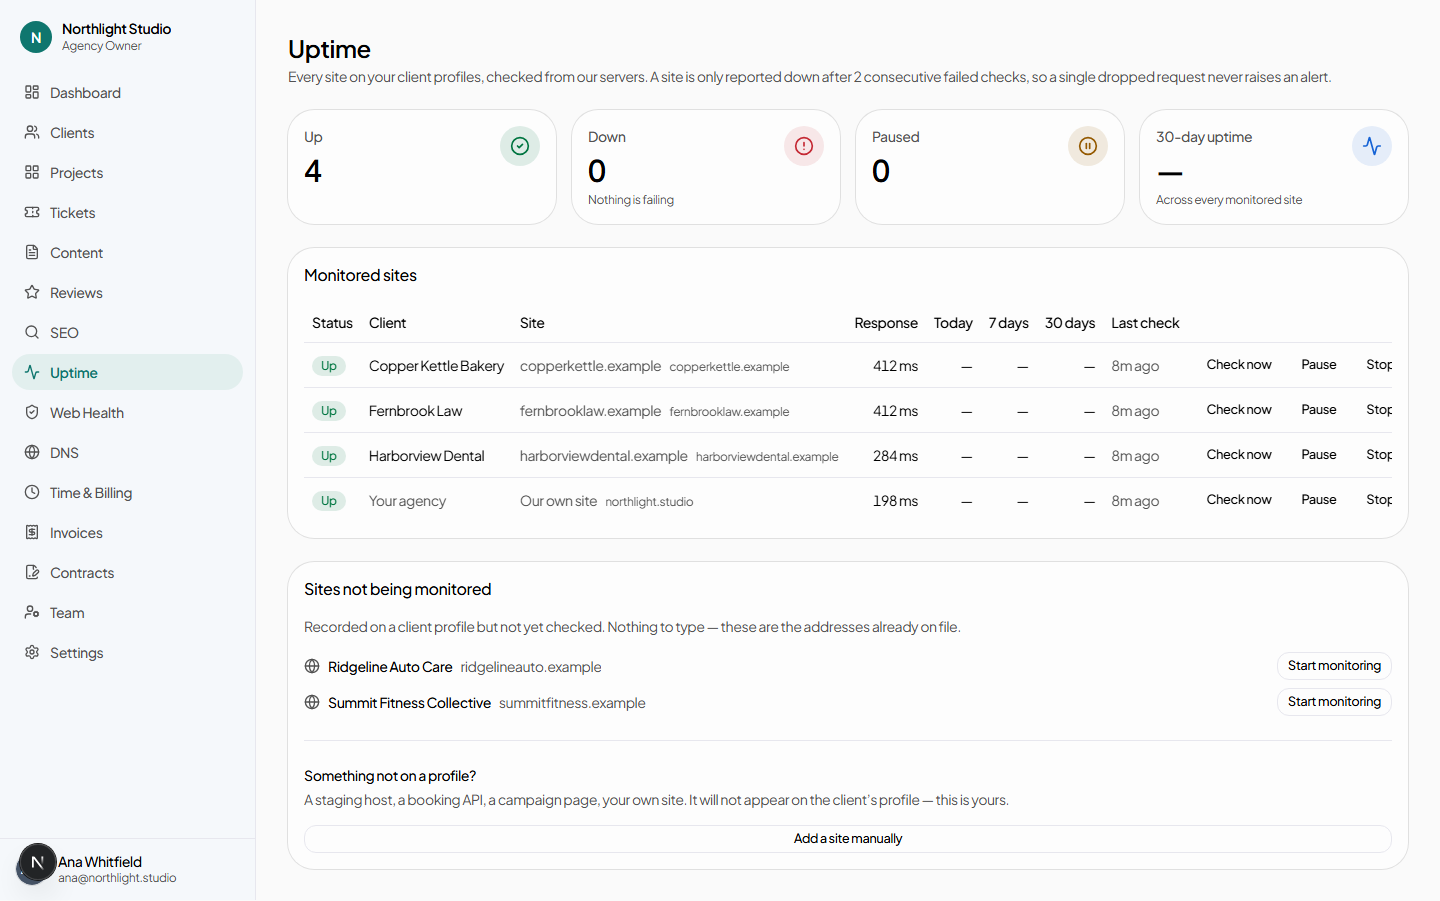
Grouped by client, with the client name linking to the client record. Per monitor:
- Check now — an immediate check, outside the schedule.
- Pause / Resume — stop checking without losing history.
- Stop — remove the monitor.
Client websites that are not yet monitored appear with a Start monitoring button on their row, so nothing has to be re-typed.
#Monitoring something that is not a client website
Add a site manually opens a short form: an address, an optional name, and a client — or No client — ours for your own site, a staging environment, or a landing page that lives outside the client's domain.
#What counts as down
A single failed check is not an outage. A site is reported DOWN only after two consecutive failures, and recovers after two consecutive successes. Between the first failure and the second, the badge shows the interim failure count beside it — so a wobble is visible without being announced.
| Setting | Value |
|---|---|
| Check interval | 5 minutes |
| Consecutive failures before DOWN | 2 |
| Consecutive successes before UP | 2 |
| Request timeout | 15 seconds |
| Redirects followed | Up to 5 |
| Individual check rows kept | 7 days |
Individual check rows are trimmed after a week by a maintenance job; the daily roll-ups and the incident records are kept, so long-run uptime figures survive the trim.
#One monitor
/admin/uptime/[id] — its recent checks, response times and incident history, with
Check now and Pause / Resume, and a link to the
client.
#Being told
An outage sends an email. Checks are performed by a sweep that runs every monitor whose interval has elapsed — it is a background job, so nobody has to have a tab open. See Background jobs.
#Limits
Monitors are bounded per client by the platform's uptime monitors per client ceiling. The number is set in the platform price book and can be excused for one agency; see Limits and cost.
#What the client sees
Uptime has no dedicated page in the client portal. Its value to the client is context: the SEO work makes more sense when you can say a ranking fell the week the site was down. That is also why the SEO Specialist role holds uptime.view and not uptime.manage — the history is evidence, and deciding what gets monitored is an account decision.